Data Visualization part
Tableau
"I have developed several projects using Power BI, Tableau, and Excel, which you can explore in my portfolio."
If you appreciate my work, please feel free to share my portfolio with others in the fields of data analytics, data engineer,Business Analysts and data scientist. Additionally,
if you have any suggestions or feedback, please don't hesitate to email me.
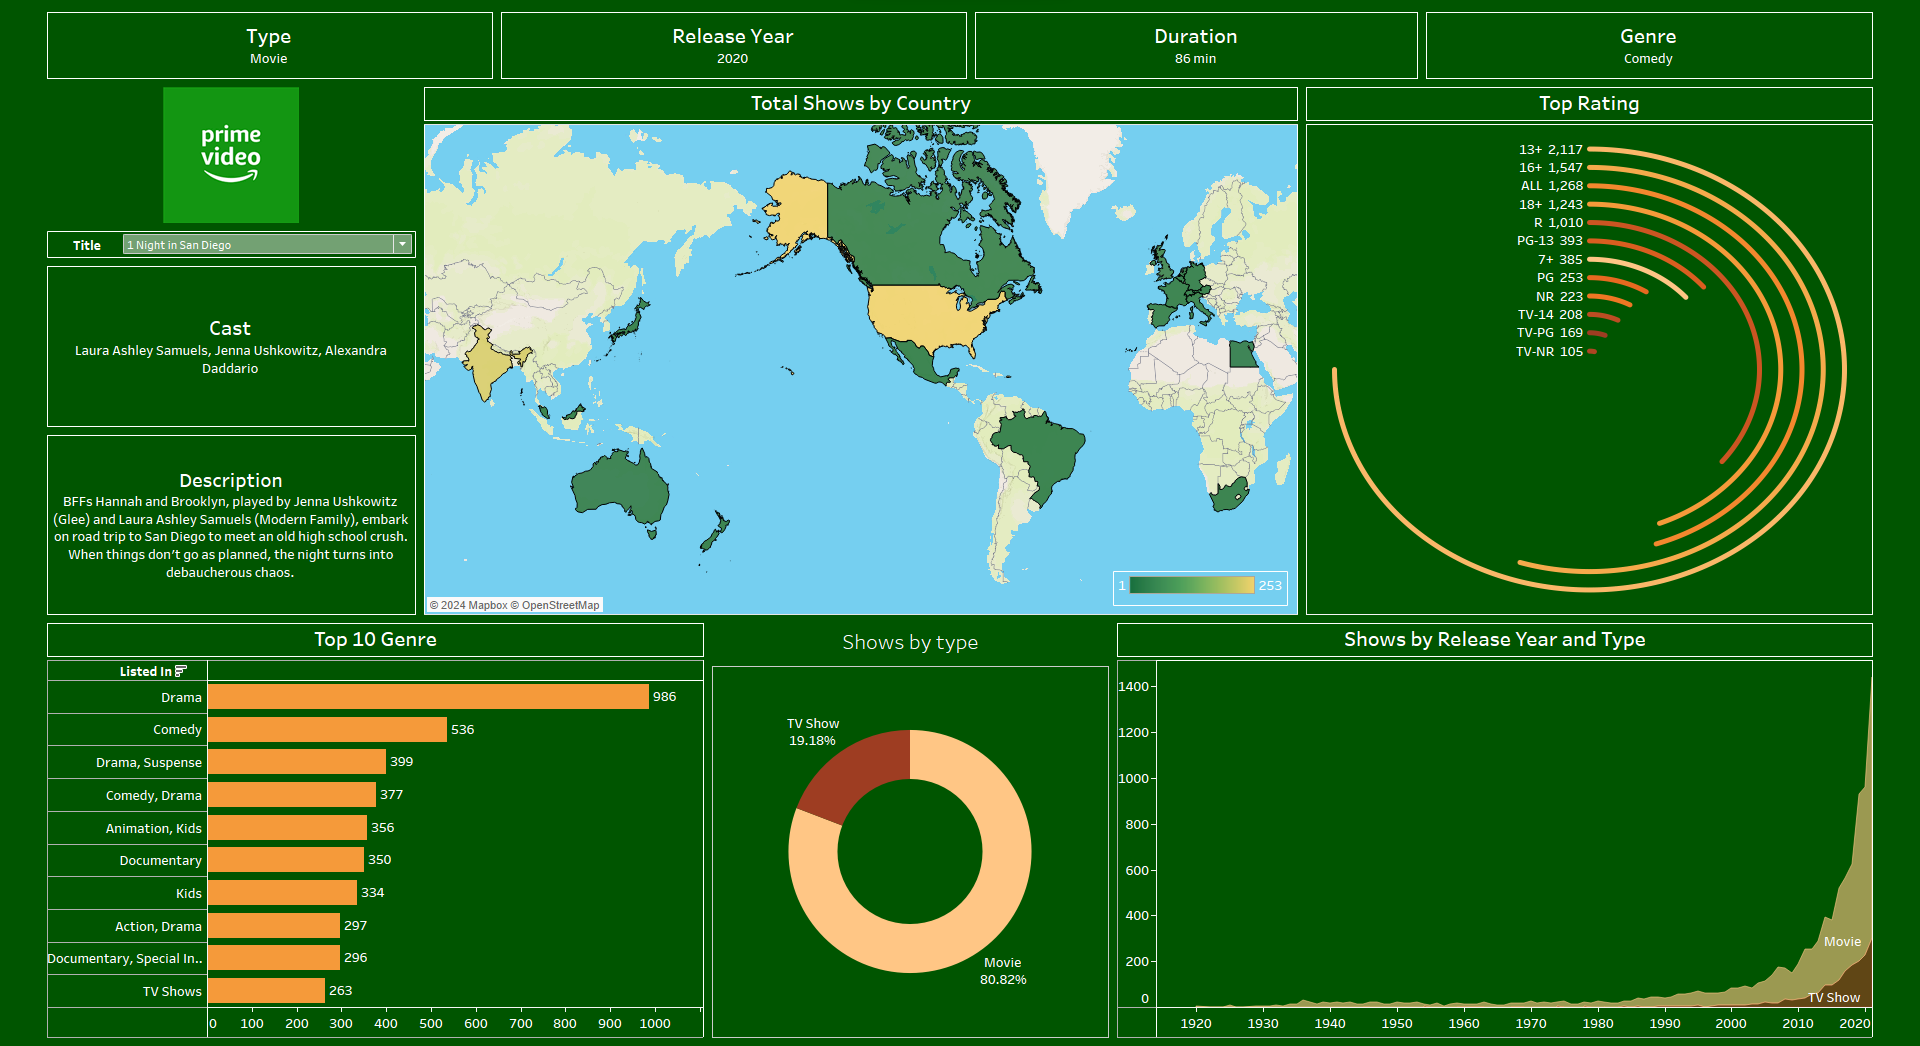
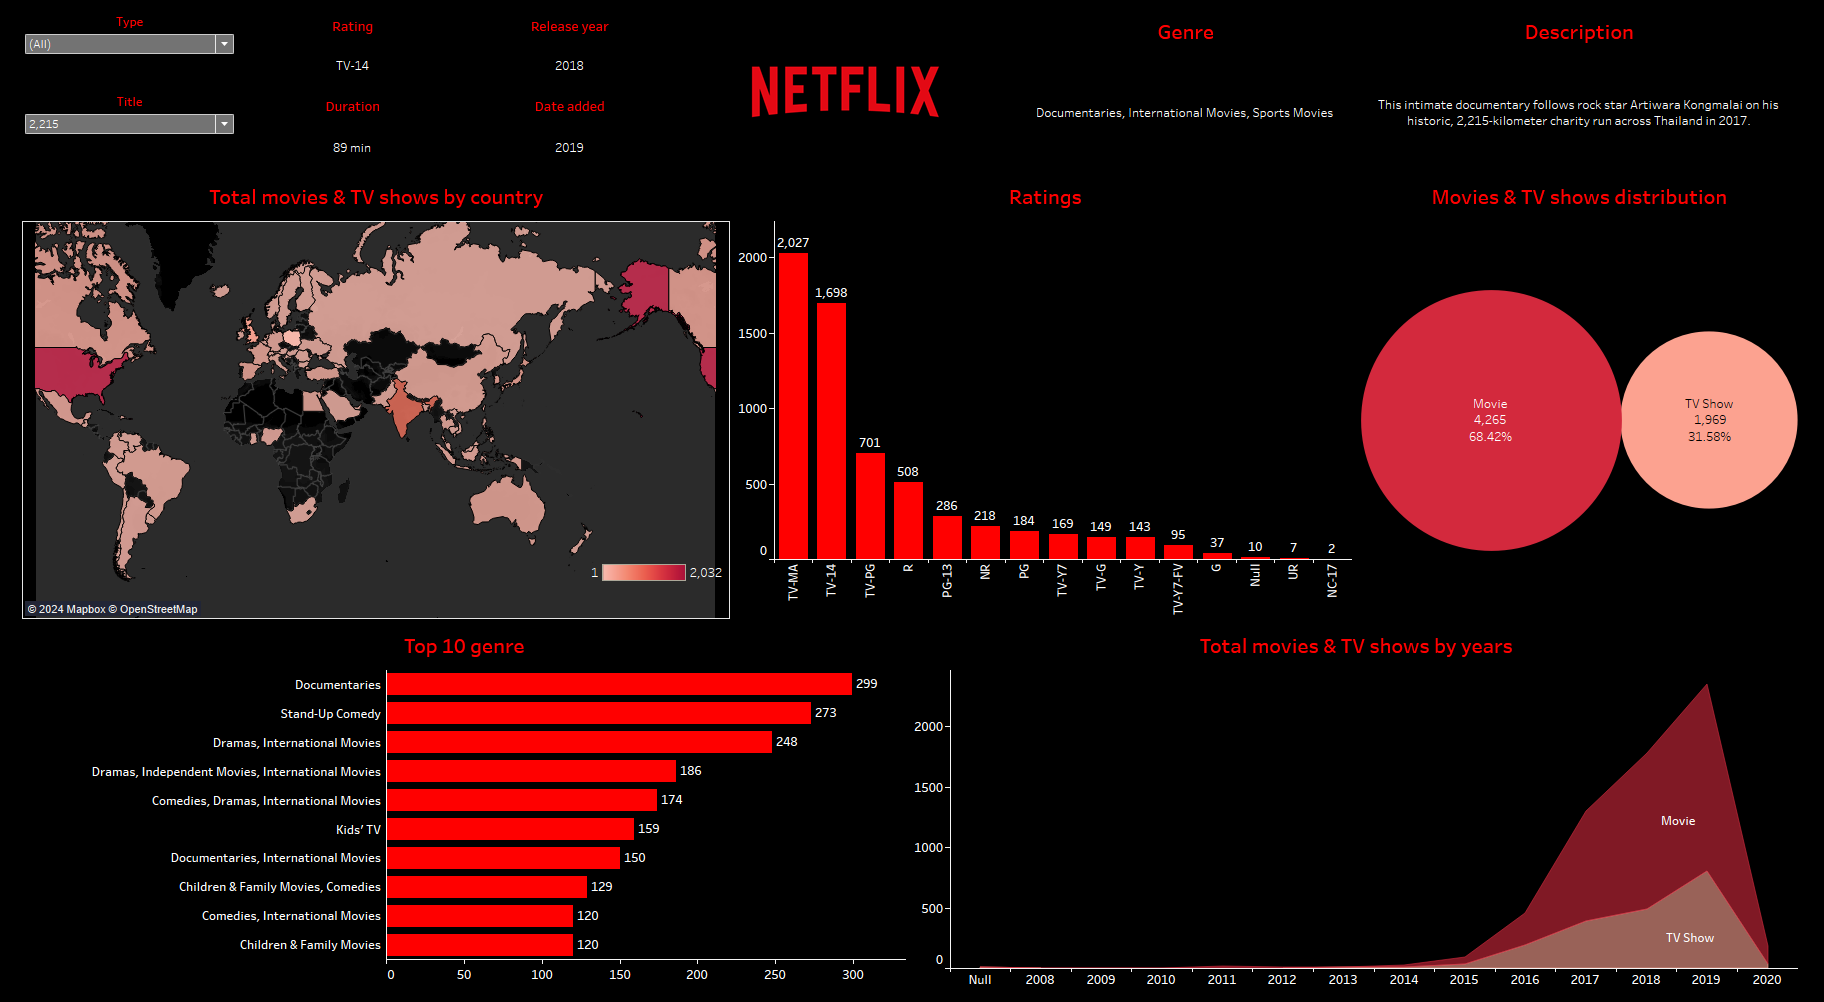
An attempt has been made to Read more...solely describe the internal data of available movies and series on Amazon Prime, without any analysis
purpose, by converting raw data into a dashboard using pivot tables, incorporating KPIs, charts, rounded line chart and maps.
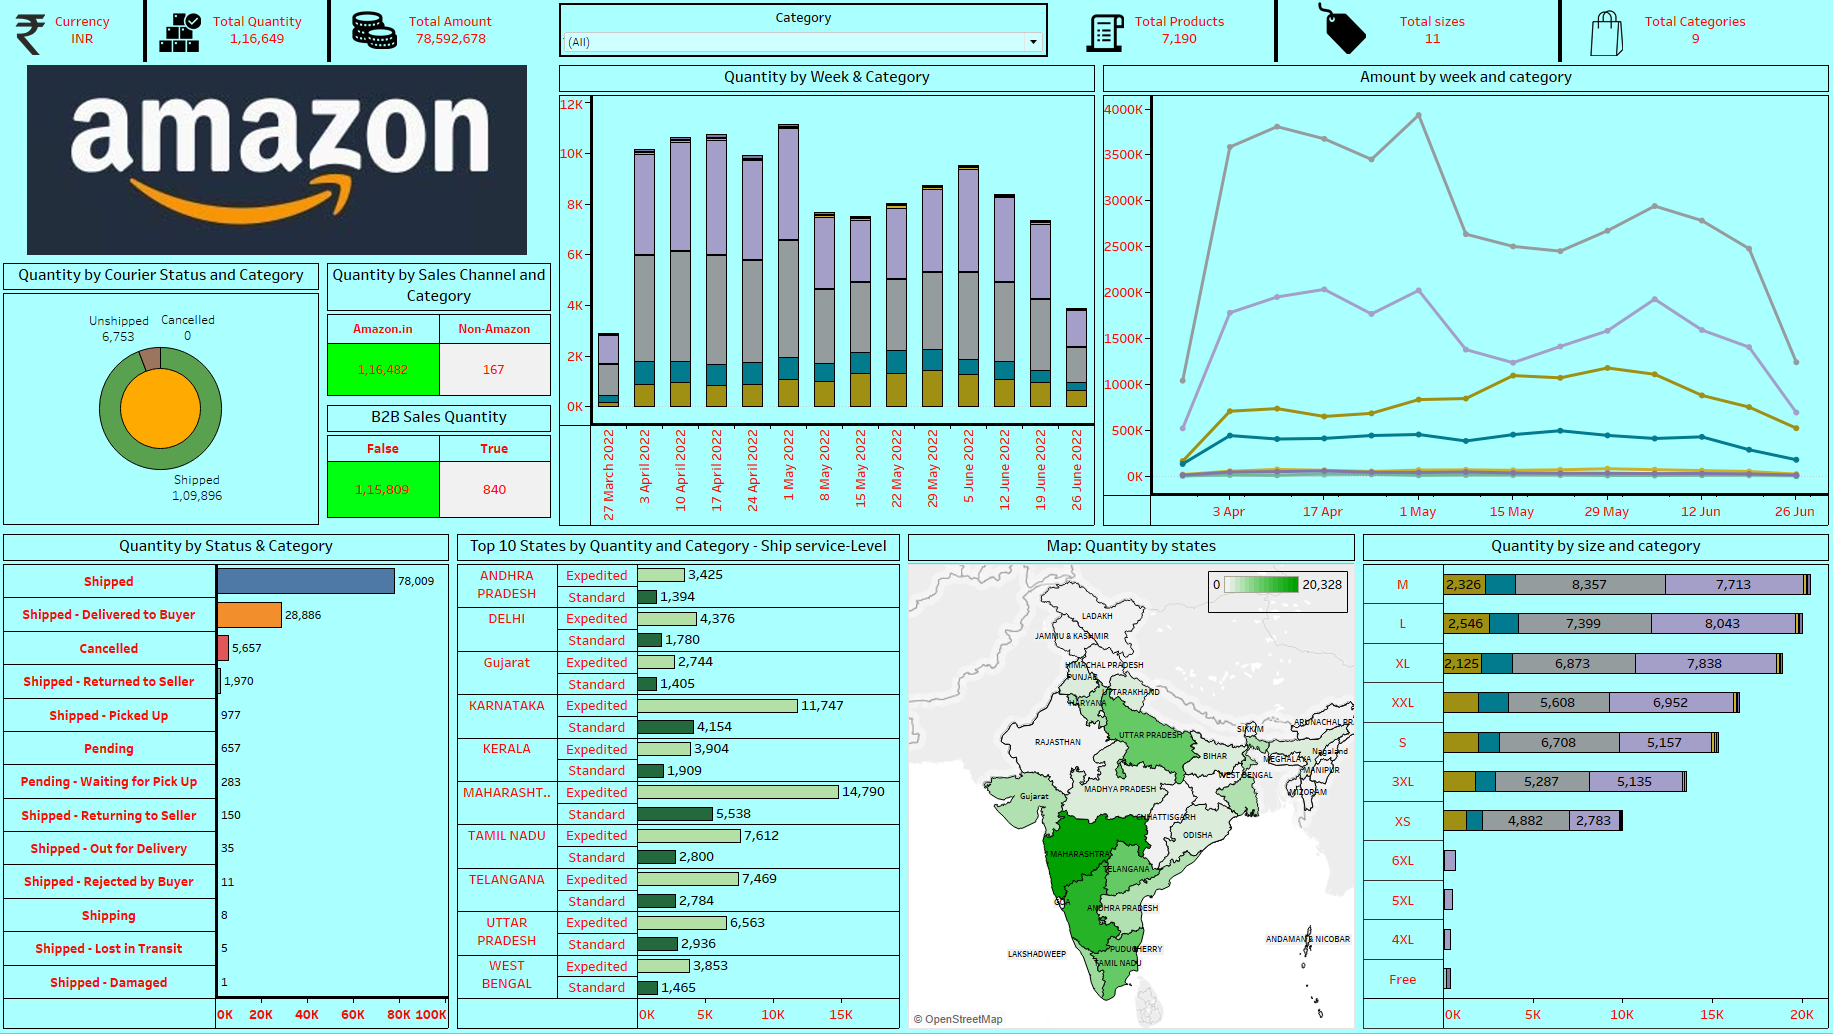
A clothing sales report for Read more...India has been created, covering the time period from March to June 2022. This dashboard describes order
shipment, state, quantity, size, and amount.
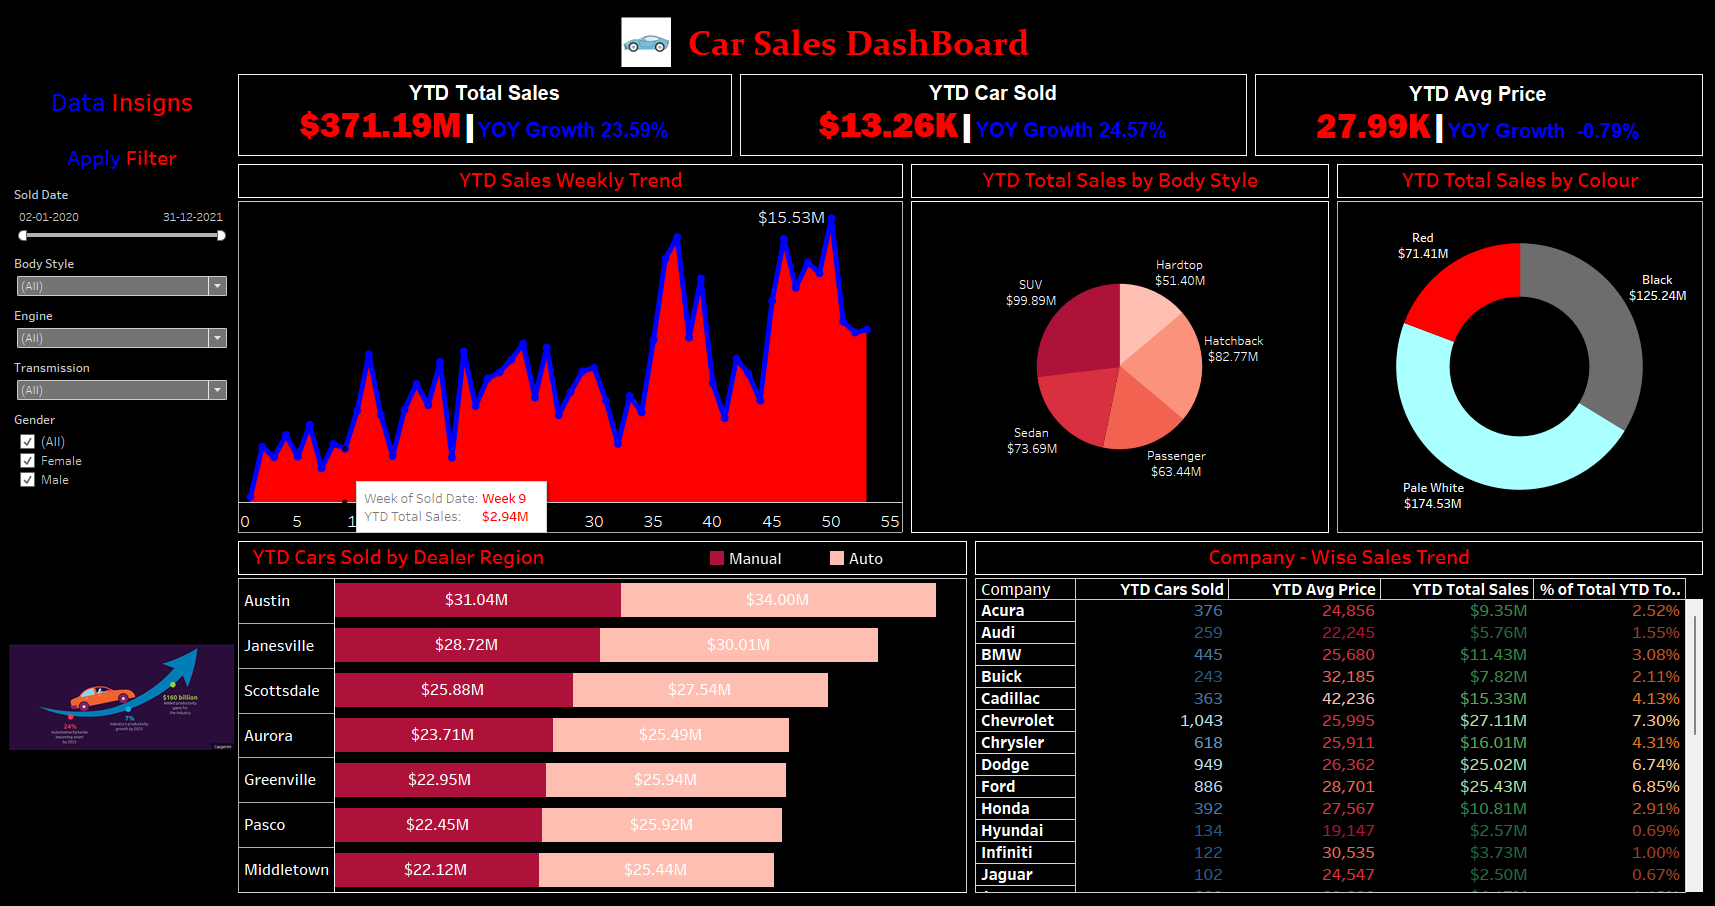
A dashboard depicting car Read more...sales in the automobile industry for the years 2020-2021 has been created, focusing on showcasing brand
progress in a simple manner.