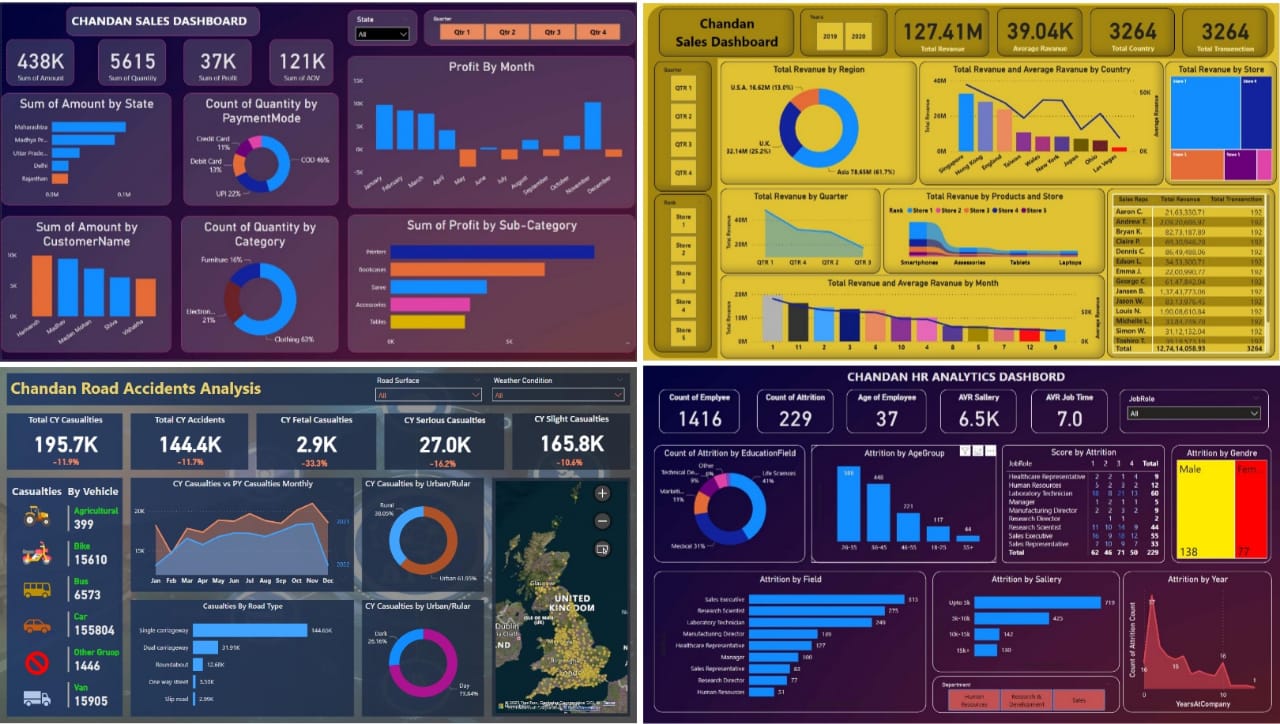
Data Visualization part
POwer bi
"I have developed several projects using Power BI, Tableau, and Excel, which you can explore in my portfolio."
If you appreciate my work, please feel free to share my portfolio with others in the fields of data analytics, data engineer,Business Analysts and data scientist. Additionally,
if you have any suggestions or feedback, please don't hesitate to email me.
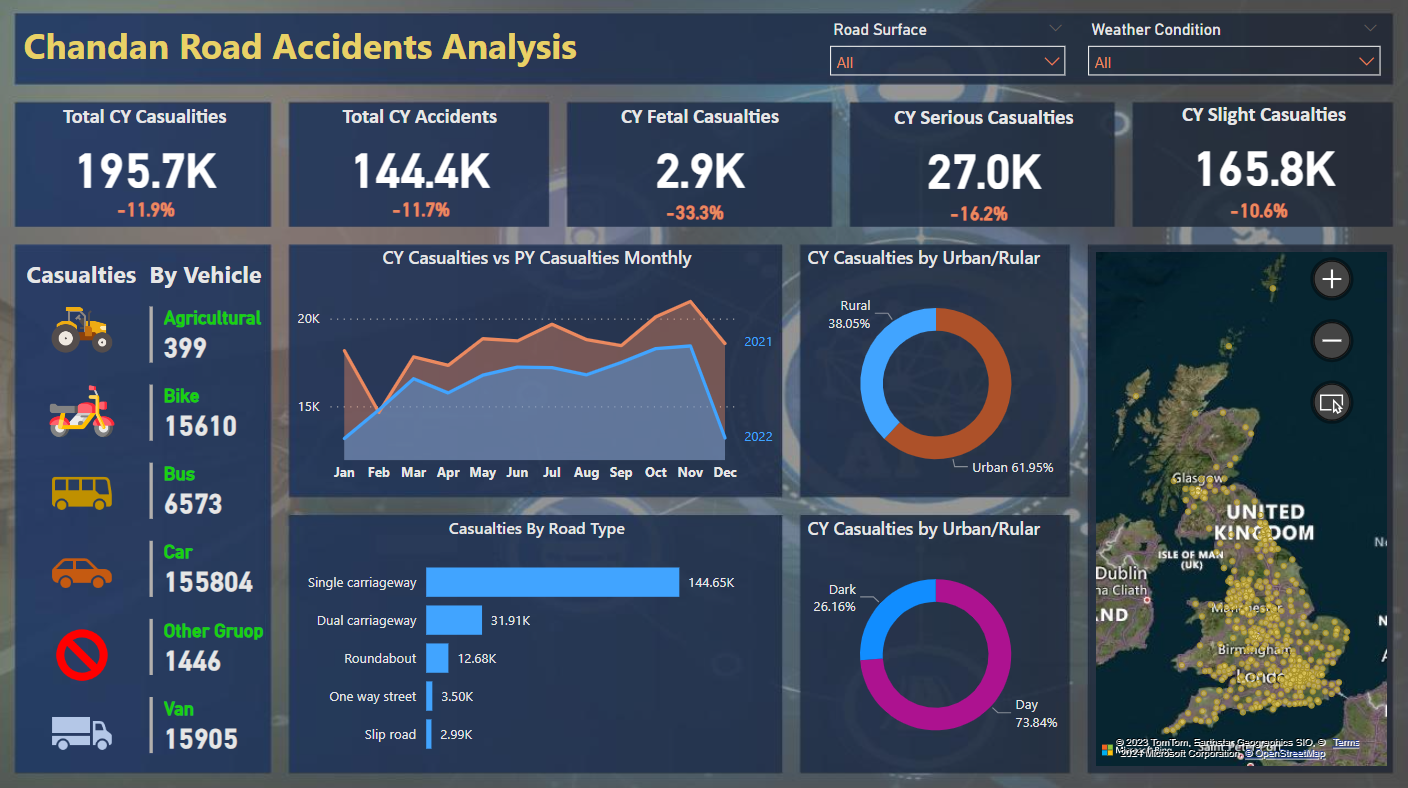
analyzing road accident data in Read more...the U.K. for the year 2021-2022. Various Key Performance Indicators (KPIs) and charts are used to provide insights into the nature and frequency of accidents, facilitating better decision-making and preventive measures.
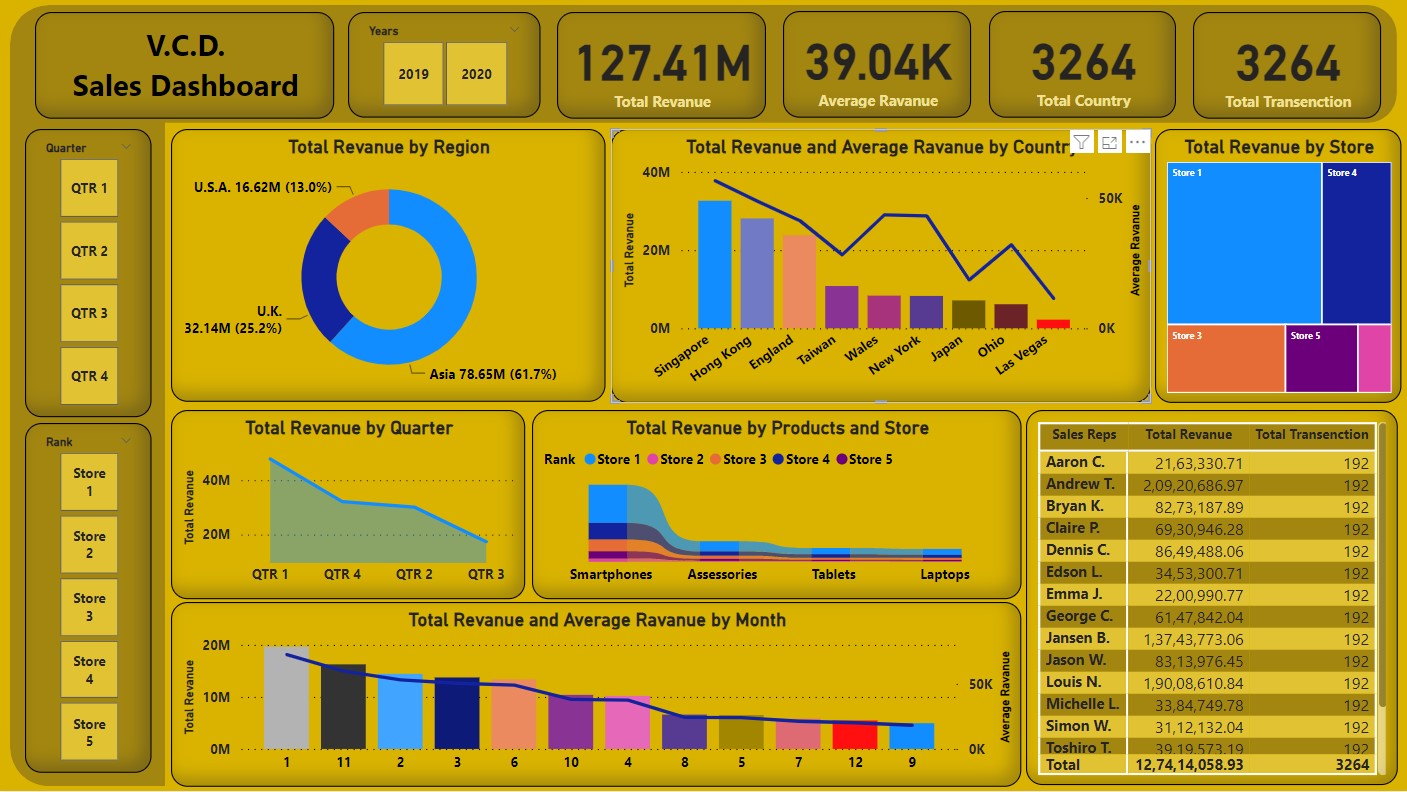
Efforts have been made to Read more... prepare a sales report using suitable charts, slicers, and KPIs for the USA, UK, and Asia, with a focus on thoughtful design in this dashboard.
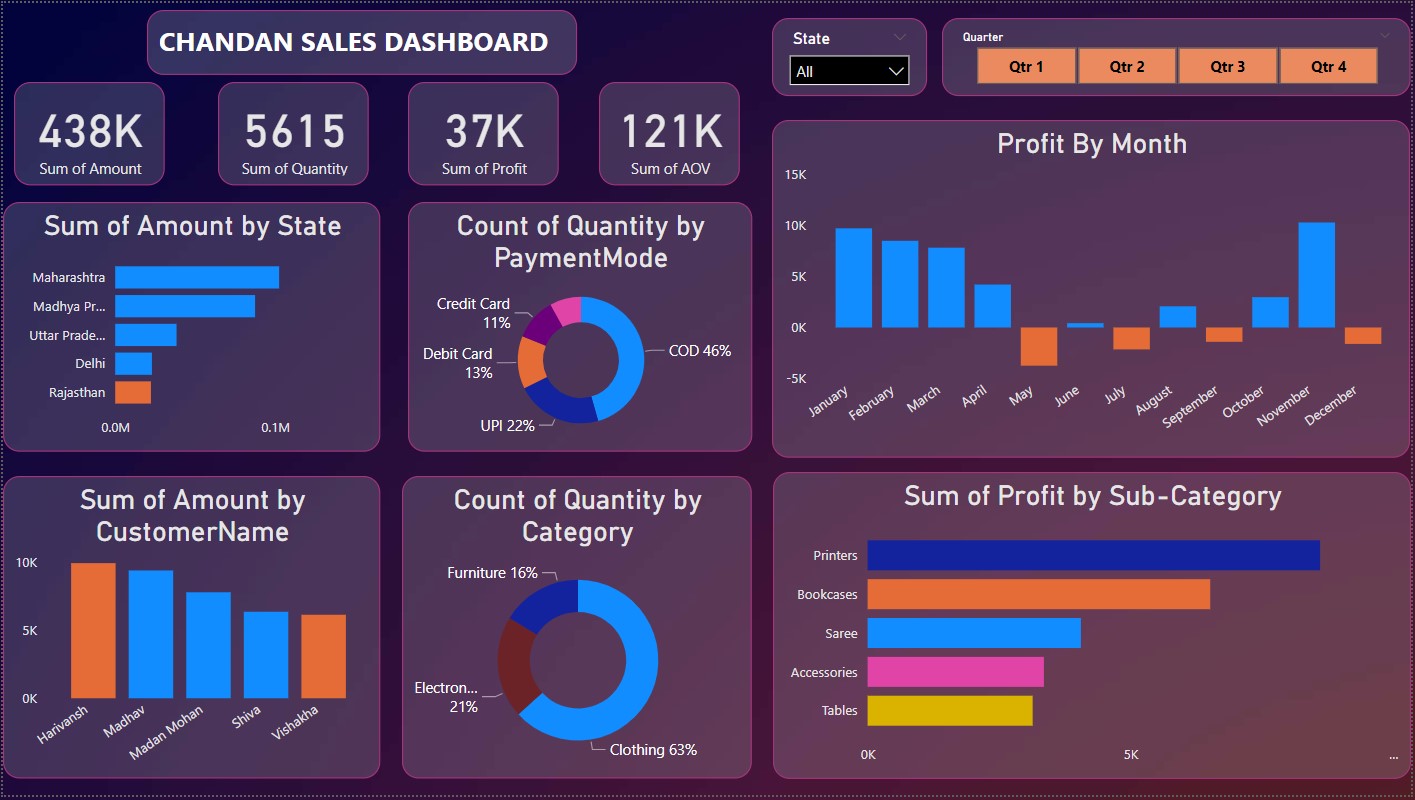
KPIs, charts, and slicers have been Read more...utilized to describe the domestic sales report of an Indian company.
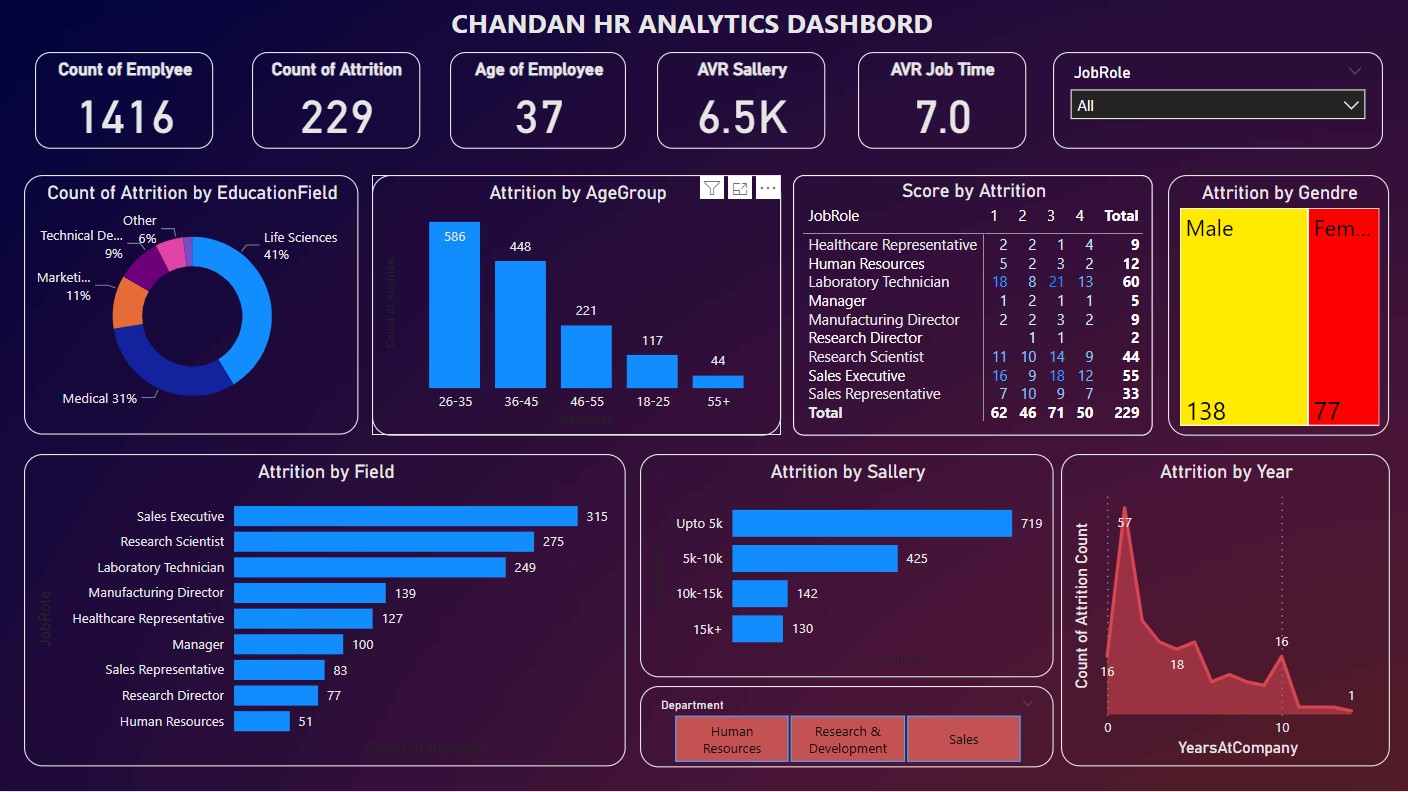
I utilized an ETL tool to clean Read more...raw data, employed KPIs for insightful details, and endeavored to describe company employees' details, salaries, and departments through various charts.