Chandan Variya
Portfolio
"I have created a project based on Power BI, Tableau, Python, MySQL, and Microsoft Excel.
Please email suggestions to variyachandan223@gmail.com".
Data Visualization part
microsoft excel
"I have developed several projects using Power BI, Tableau, and Excel, which you can explore in my portfolio."
If you appreciate my work, please feel free to share my portfolio with others in the fields of data analytics, data engineer,Business Analysts and data scientist. Additionally,
if you have any suggestions or feedback, please don't hesitate to email me.
Disclaimer:
"This project is created strictly for educational and research purposes."
"The analysis presented here is based on publicly available information and academic study."
"Any references to terrorism, extremist ideologies, groups, or incidents are solely for the purpose of analysis, awareness, and understanding."
"This project does not promote, support, justify, or endorse violence, terrorism, or any illegal activities in any form."
"The creator bears no intention to harm any individual, group, religion, country, or organization."
The dataset, initially stored in the format of the Profiles of Individual Radicalization in the United States (PIRUS) Codebook, was curated by
professors at the University of Maryland, documenting terrorism attacks in the USA from 1984 to 2021. It was decoded using an ETL (Extract,
Transform, Load) tool, summarized using pivot tables, and then visualized using suitable charts to create six dashboards focusing on the
following aspects:
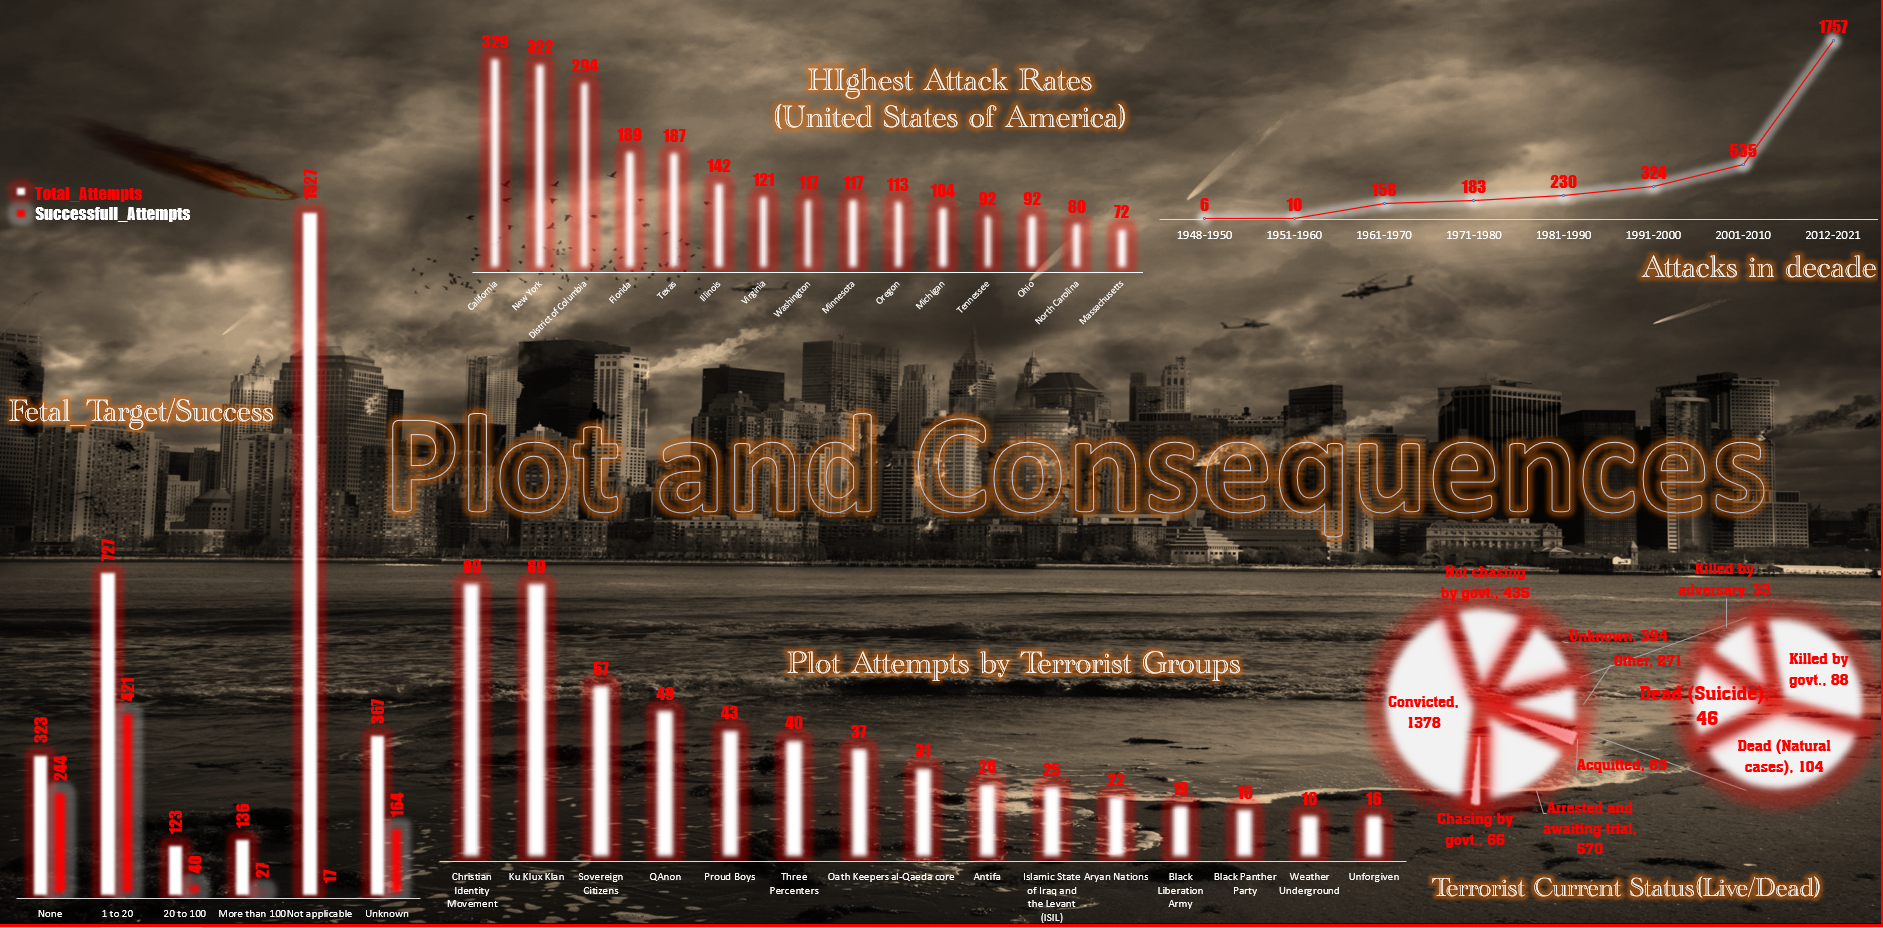
1. Plot and consequences
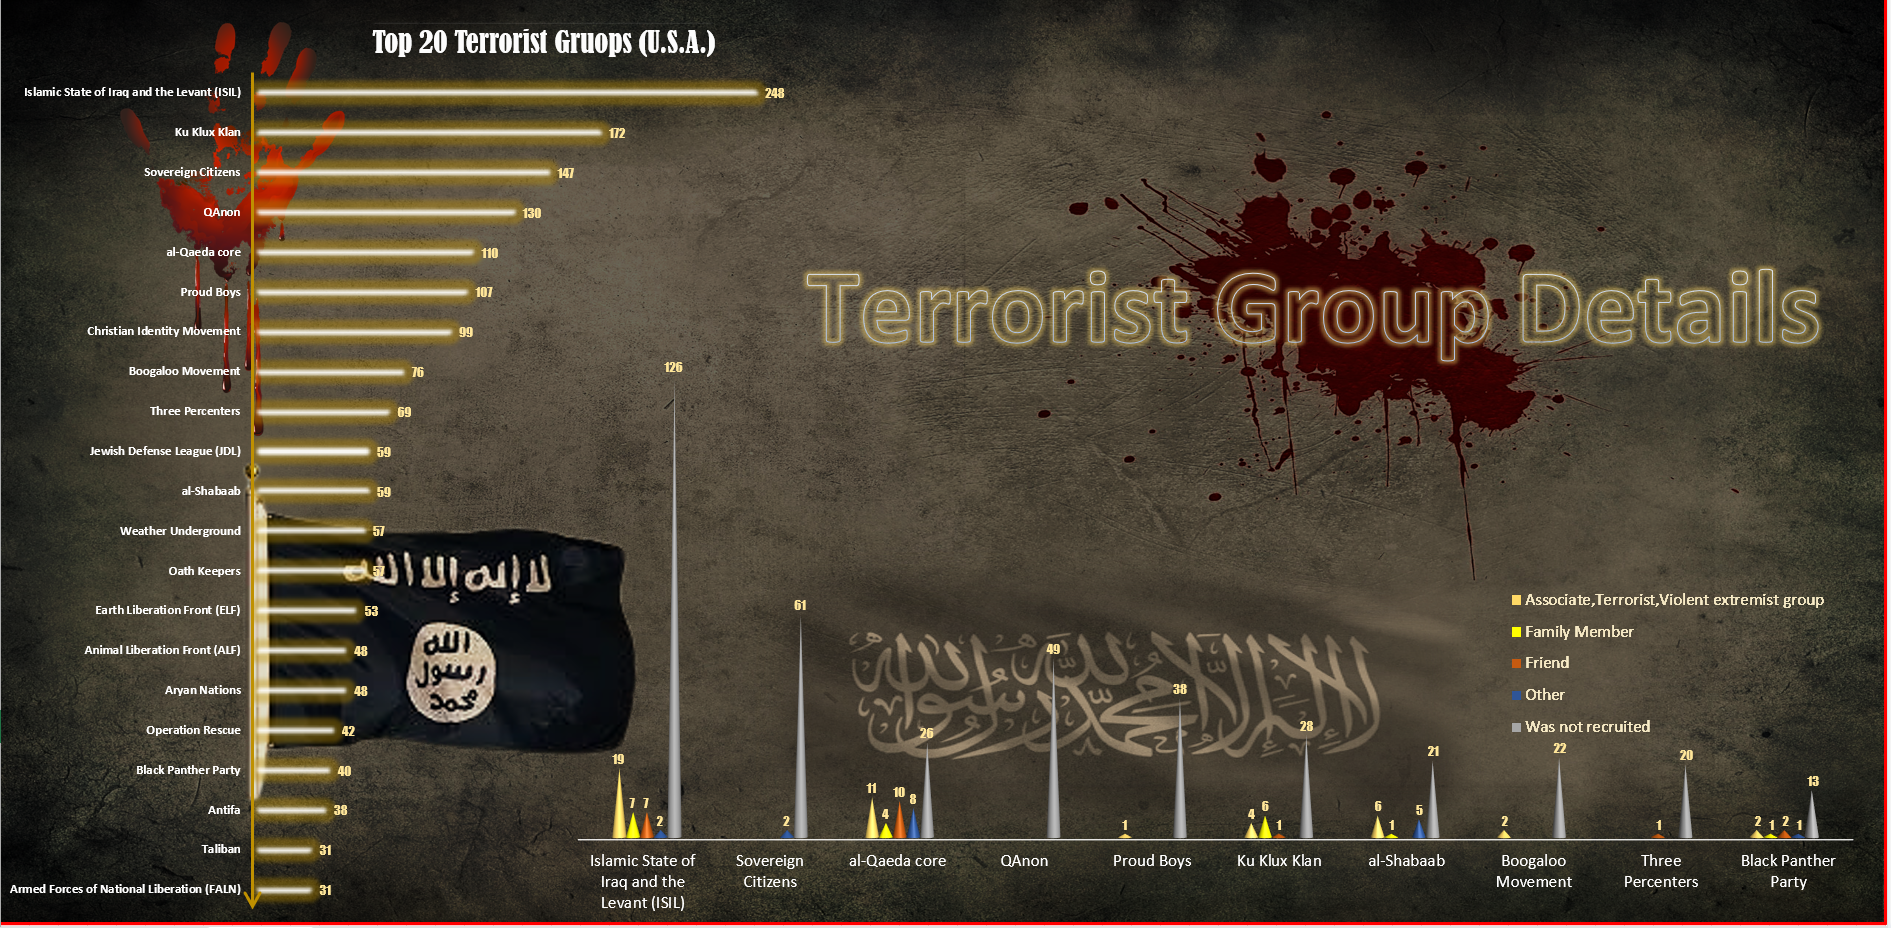
2. Terrorist group details
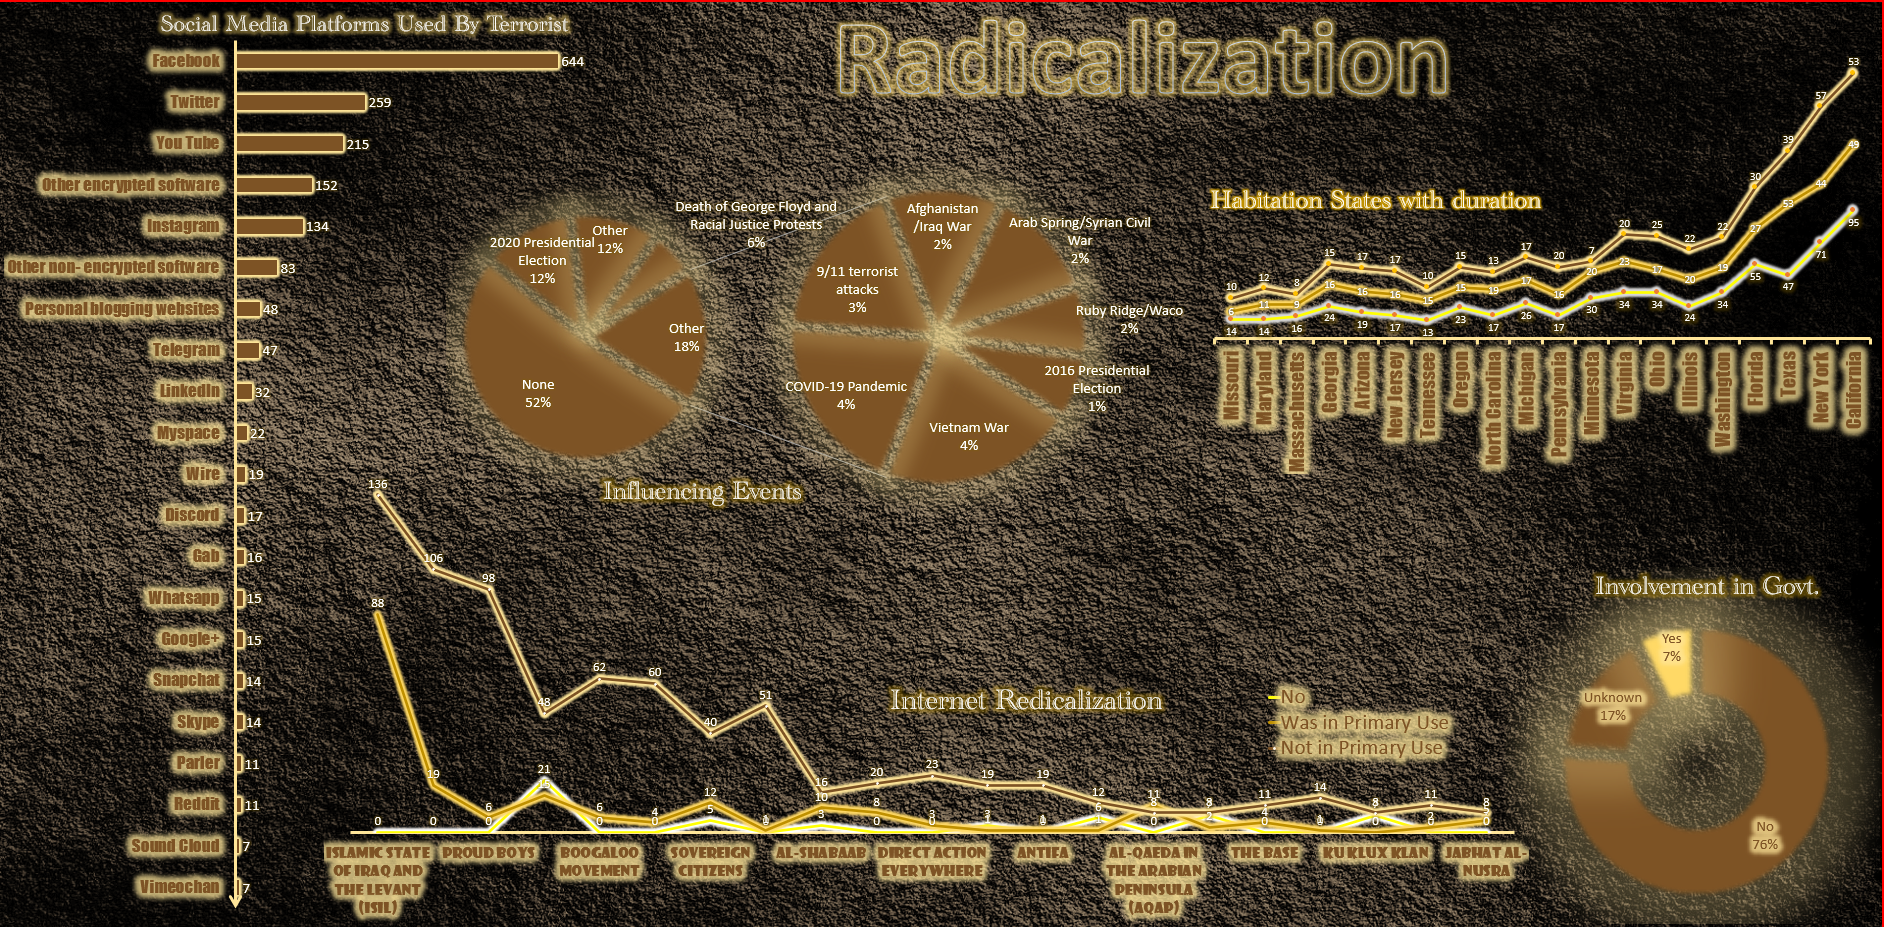
3. Radicalization
4. Demographics
.png)
5. Socioeconomic status
.png)
6. Personal details
.png)
Efforts were made to provide a comprehensive summary of these six dashboards.
.png)